Products
 AVA (Analysis Virtual Assistant)
Your AI Data Analyst
AVA is an AI data analyst designed to help any professional efficiently analyze and interpret complex datasets. It solves the challenge of modern data work by automating the inefficient and time-consuming manual processes of data parsing, analysis, and visualization.
For professionals who need to derive insights from data, regardless of their background or expertise, AVA bridges the skill gap, empowering them to turn raw data into actionable insights without writing a single line of code.
Core Capabilities
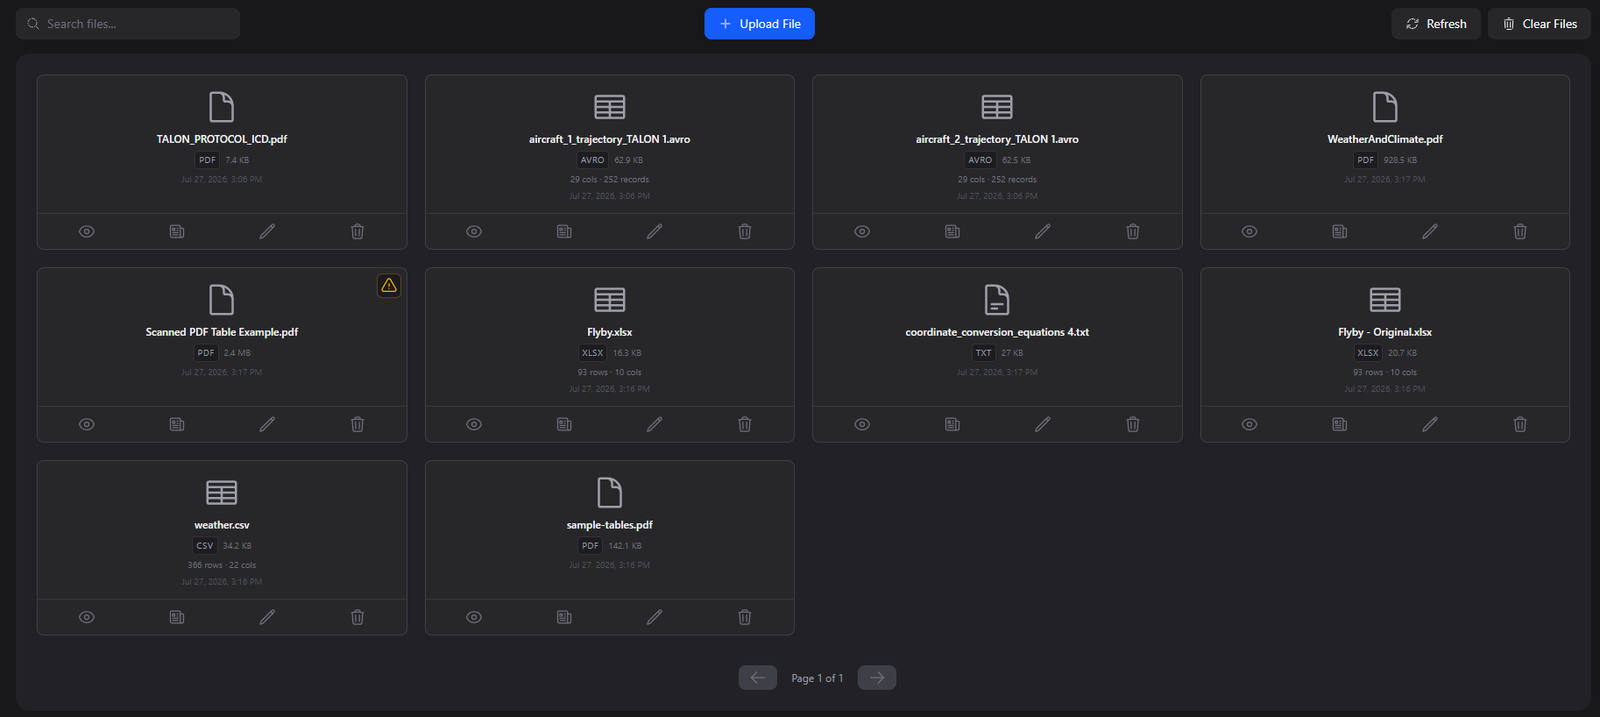
Upload Data
Upload your files and let AVA automatically parse them to generate insights and summaries, preparing your data for analysis.
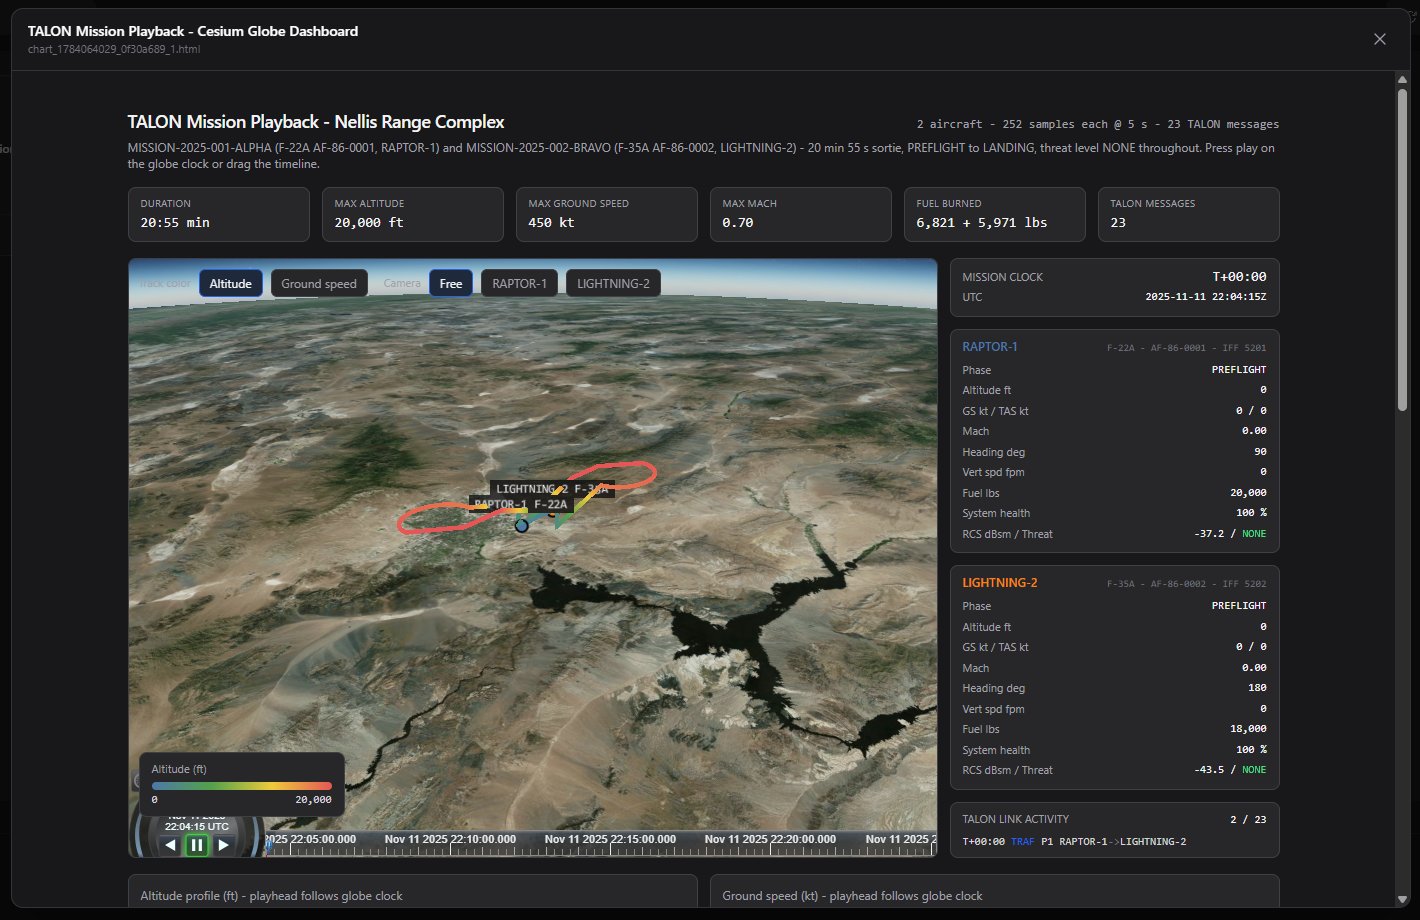
Generate Visualizations
Create charts, graphs, and rich HTML pages. AVA makes it simple to share your data story with stakeholders.
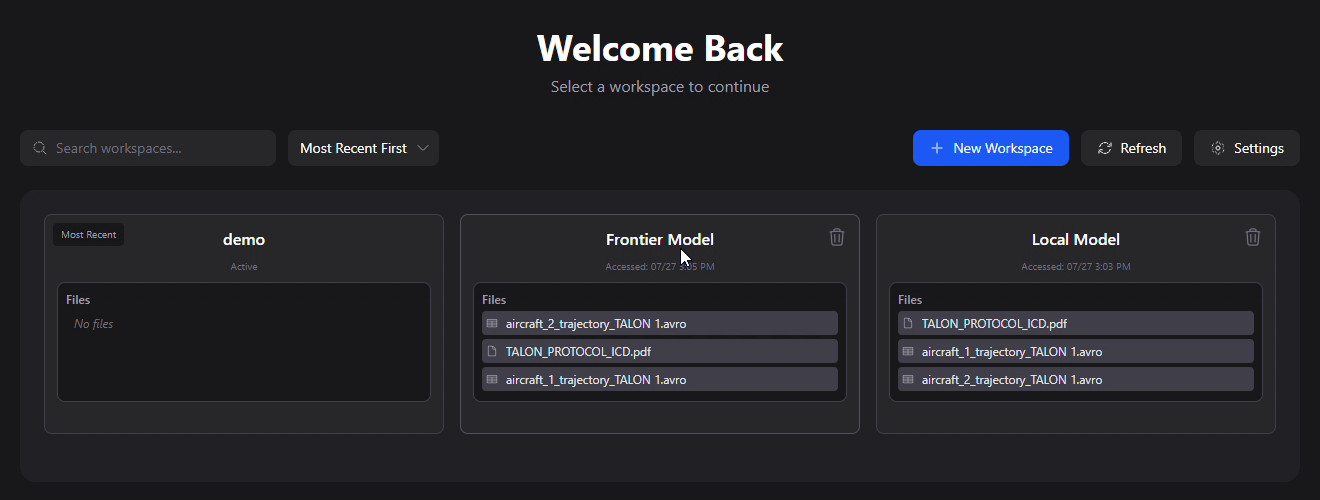
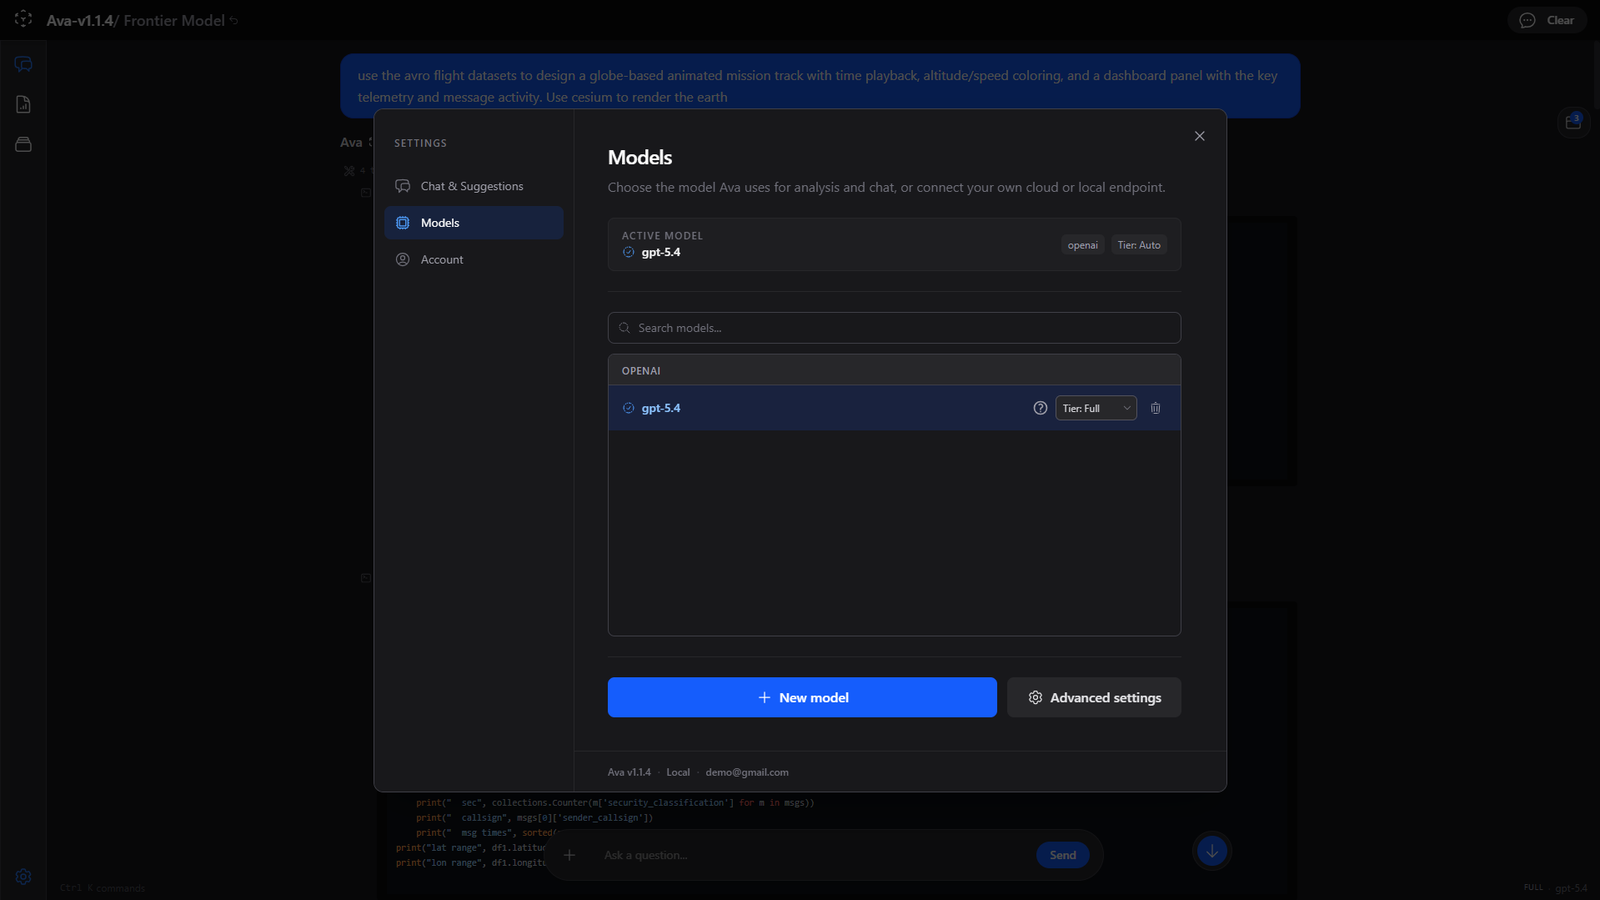
Manage Workspaces
Organize your analysis in custom workspaces. Keep your datasets, insights, and visualizations structured and accessible for ongoing projects.
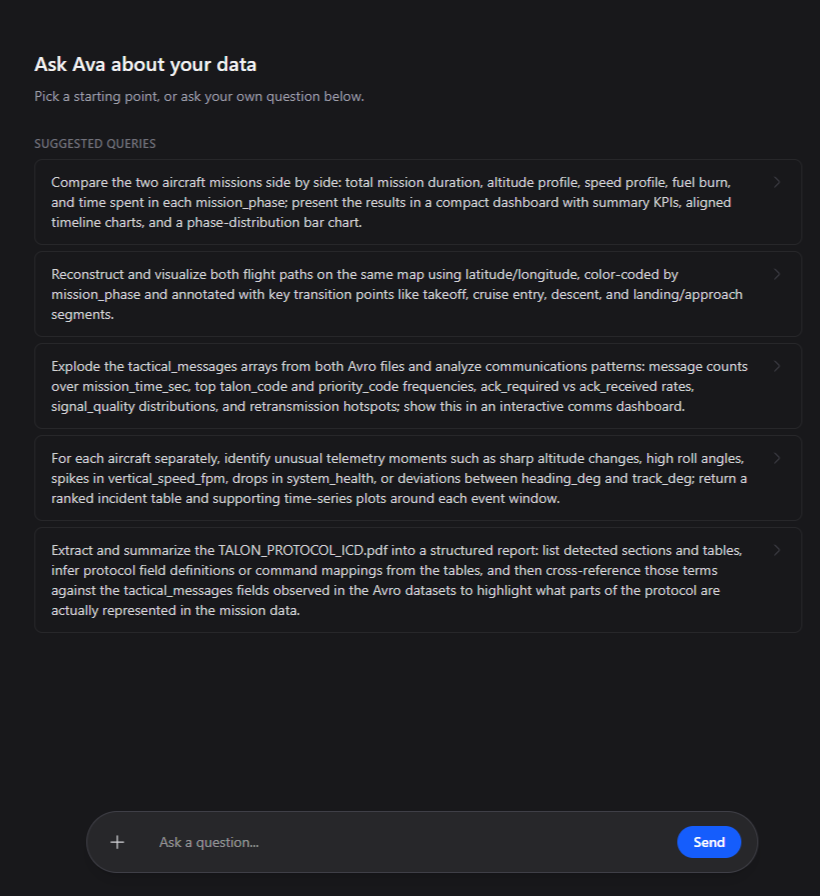
Receive Guidance
AVA provides suggested queries and highlights potential areas of interest, guiding you toward the most valuable insights in your data.
Why Use AVA?
- Efficiency: Automate slow, manual processes. Get fast, repeatable analysis results.
- Augmentation: Improve the efficiency of skilled coders and analysts by removing repetitive tasks, allowing them to focus on high-impact work.
- Empowerment: Enable professionals without deep coding or data science expertise to perform their own analysis.
- Precision: Every answer is computed by real Python run against your data, giving you more control and more precision than generic tools.
AVA in Action
Dynamic Chart Generation
AVA automatically generates interactive ChartJS visualizations from your data. Users can hover, click, and explore the charts dynamically, with AVA handling all the technical implementation to create engaging, responsive visualizations that adapt to user interaction.
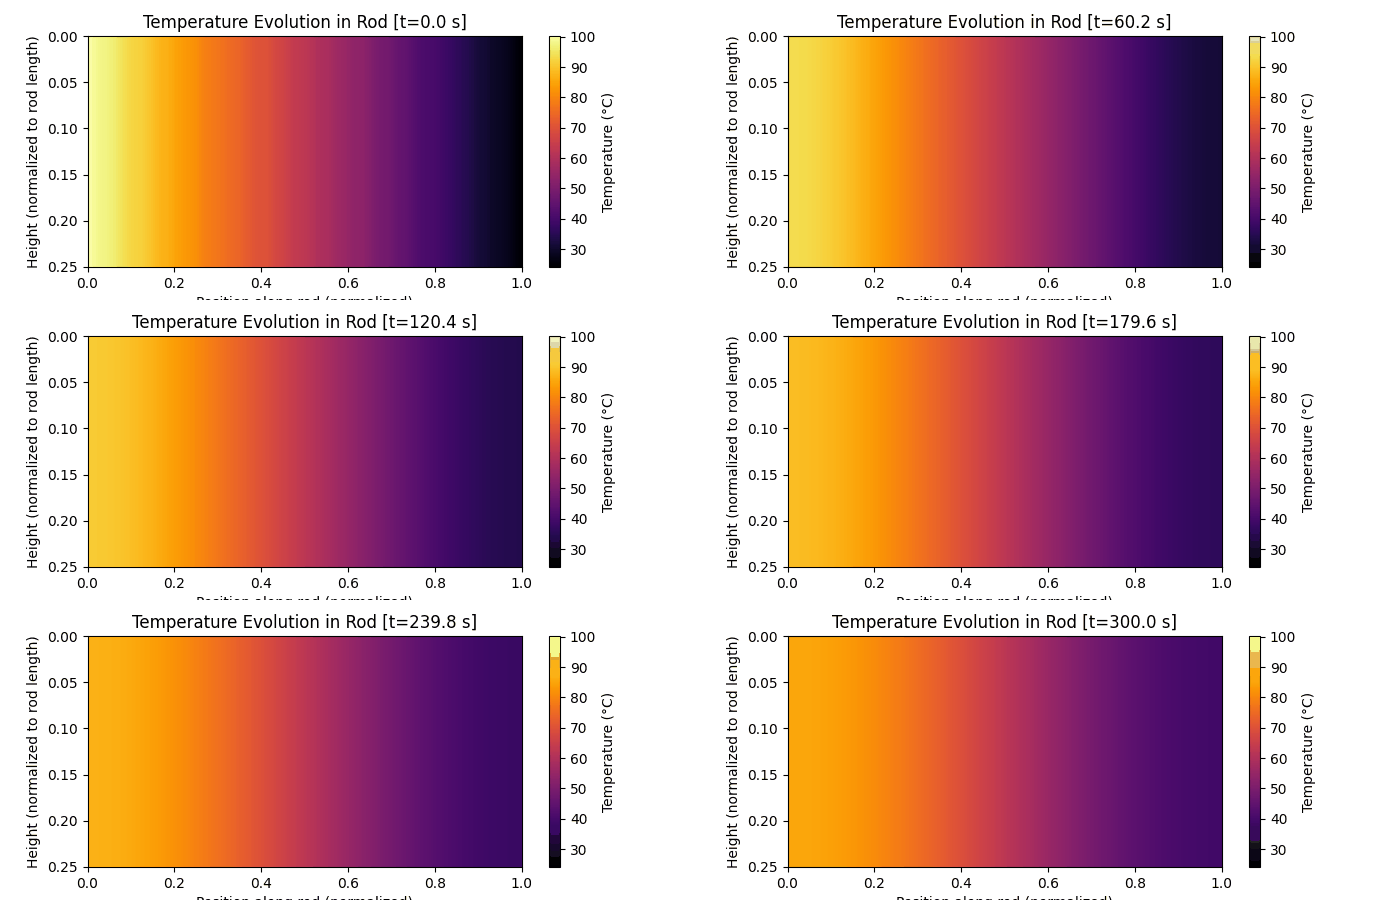
Temperature Evolution Heatmap
AVA generated a physics simulation modeling temperature evolution over time on a metal rod exposed to heat. The animated heatmap visualizes thermal dynamics and heat propagation through materials, providing clear insight into thermodynamic processes.
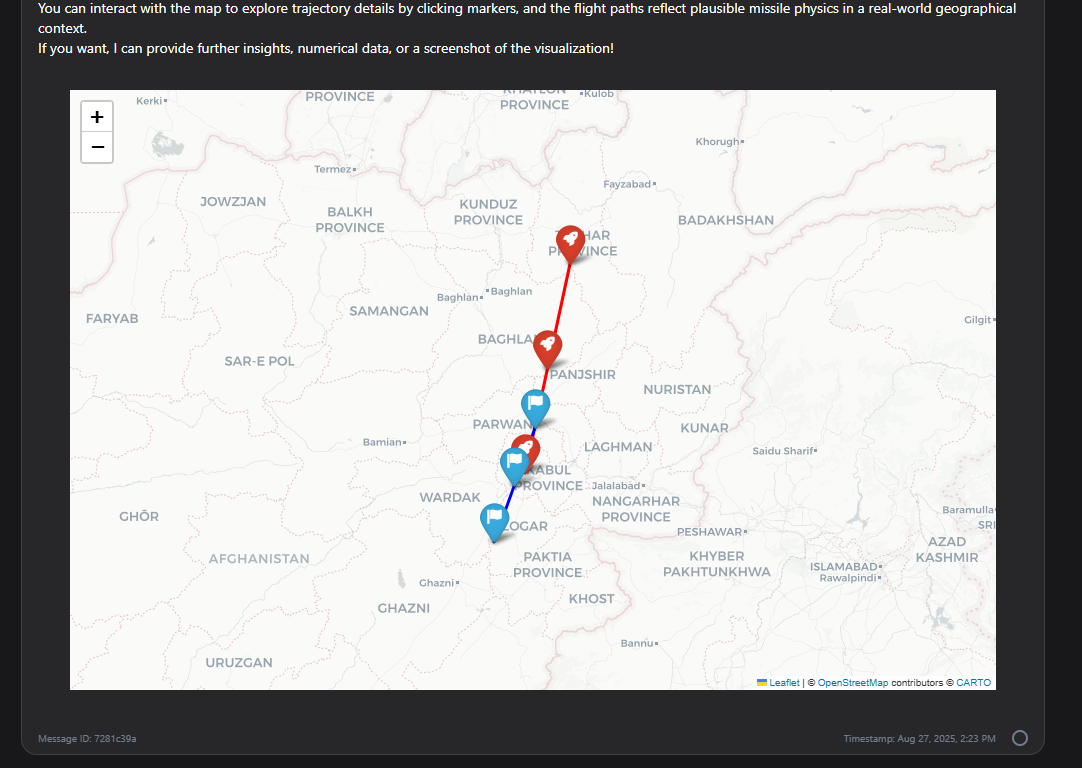
Interactive HTML Map Report
AVA combined spatial information from interceptor entity log files with model behavior data to create an interactive HTML map, extracting location data from logs and behavioral patterns from model files to produce comprehensive spatial visualizations.
Additional Examples
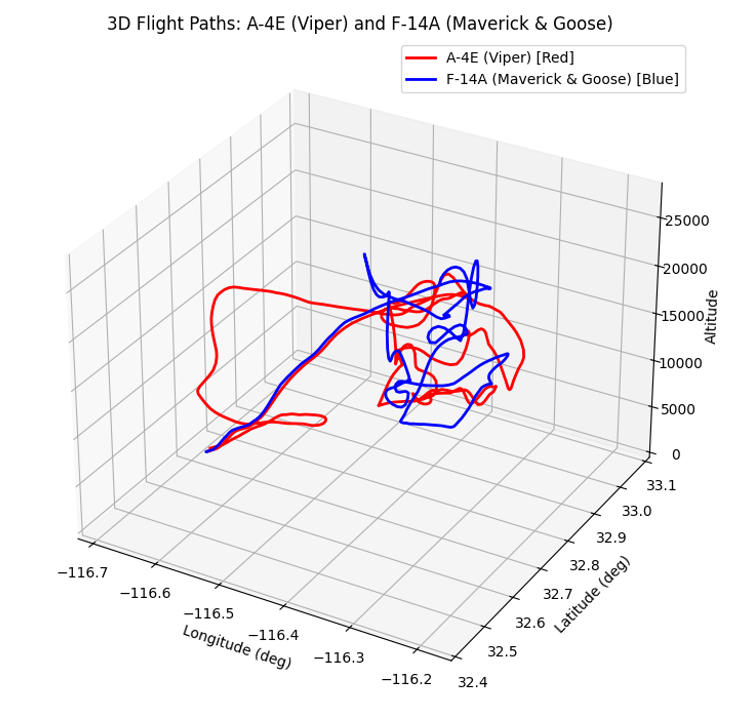
Comparative Performance Analysis
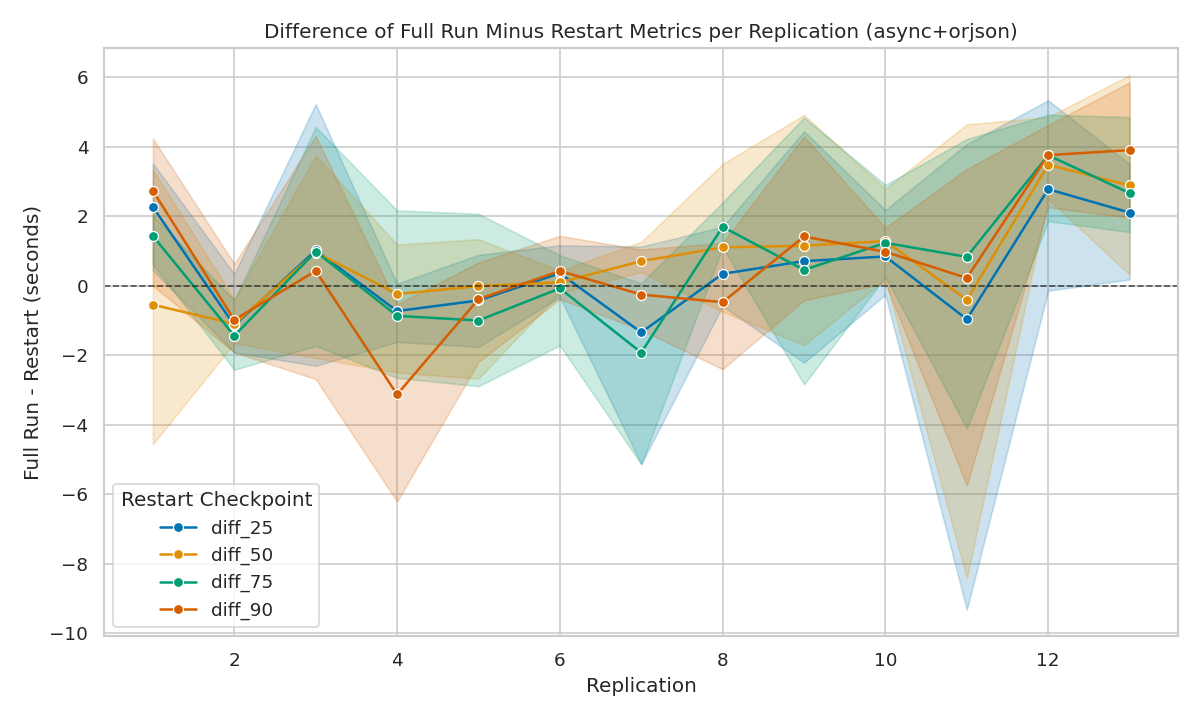
Statistical Chart Generation
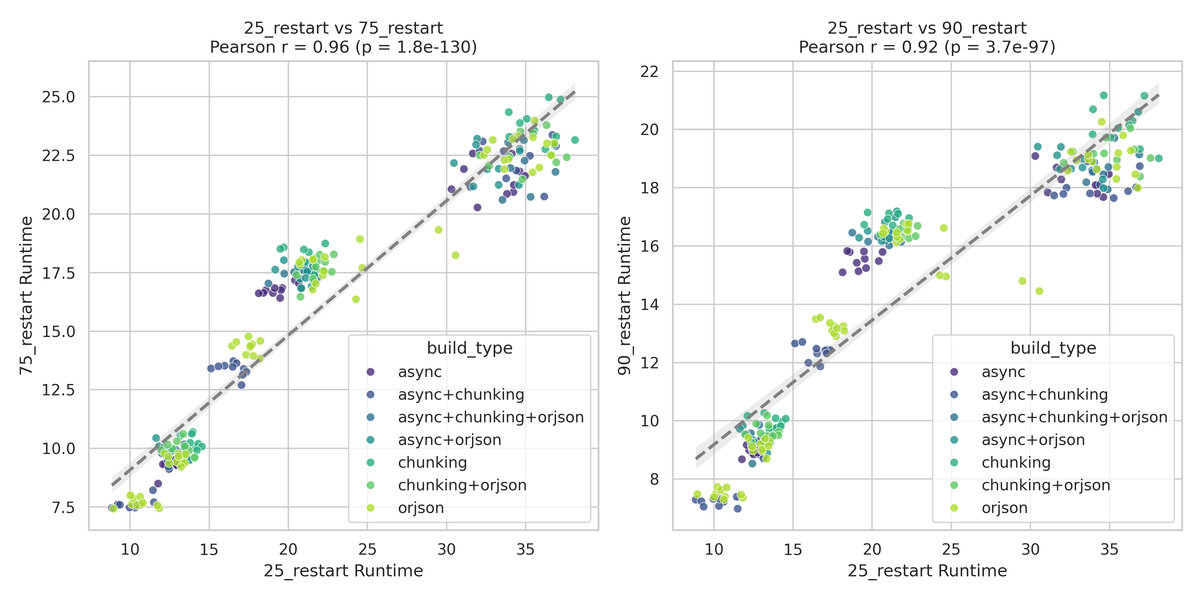
Advanced Data Visualization
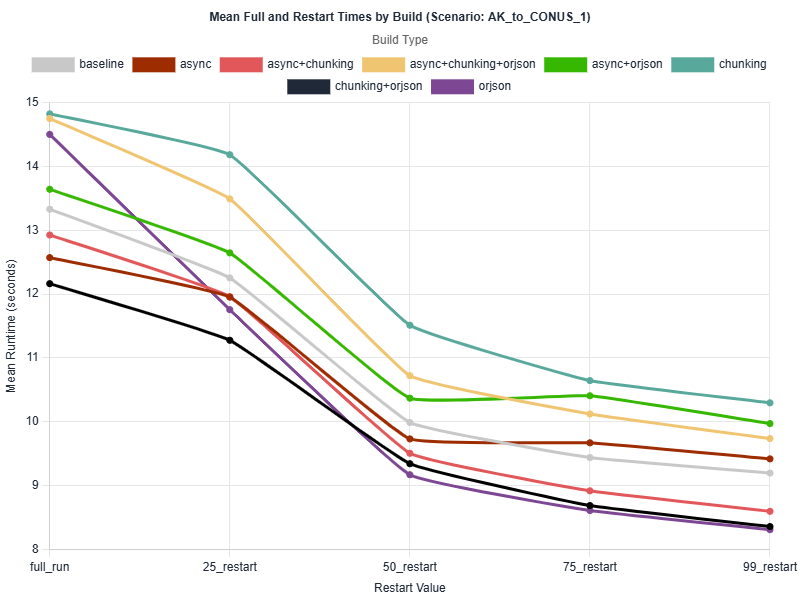
Benchmark Analysis
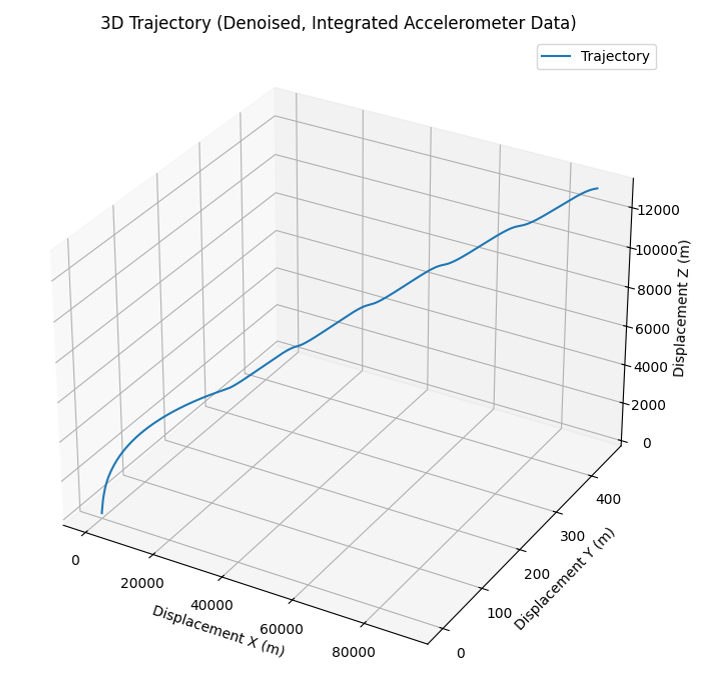
Accelerometer Data Analysis
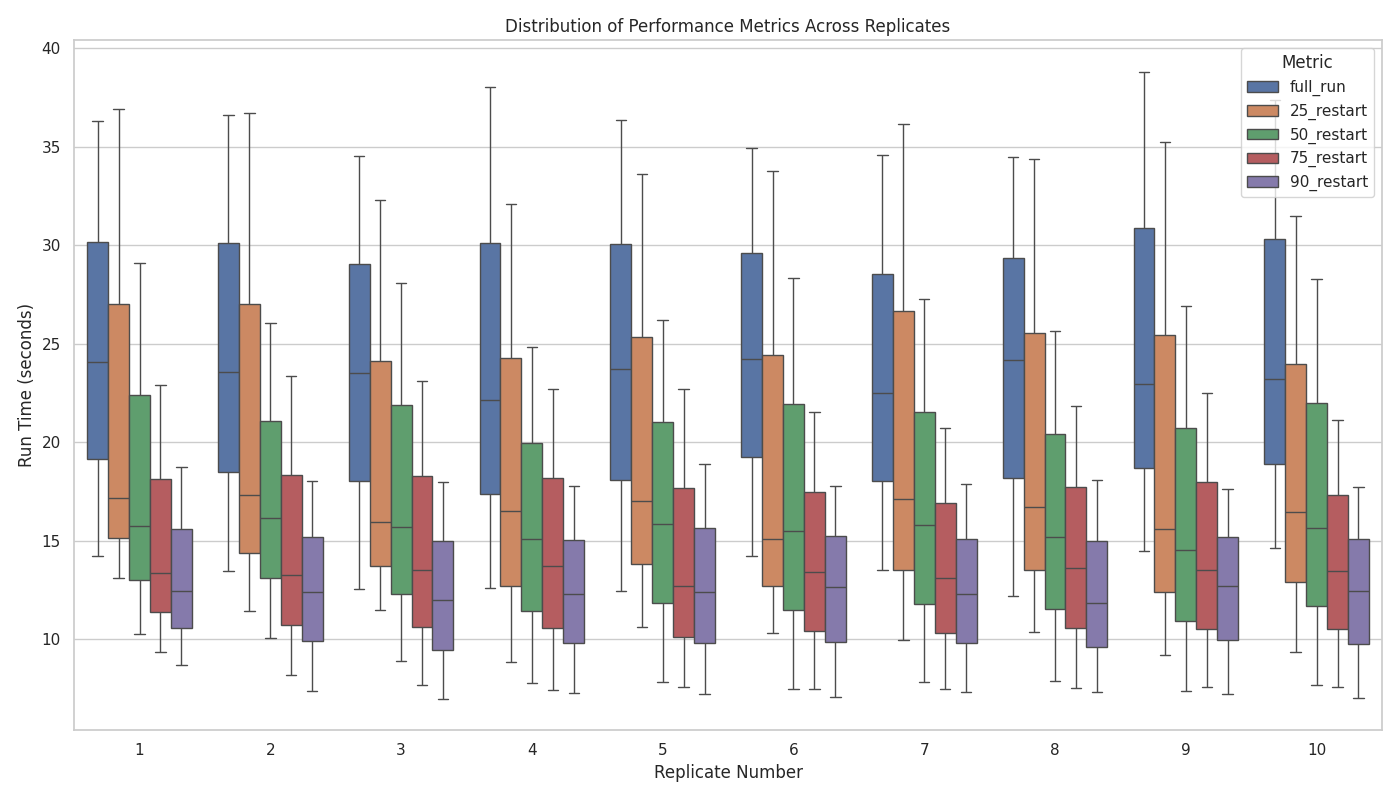
Multi-Variable Chart Analysis
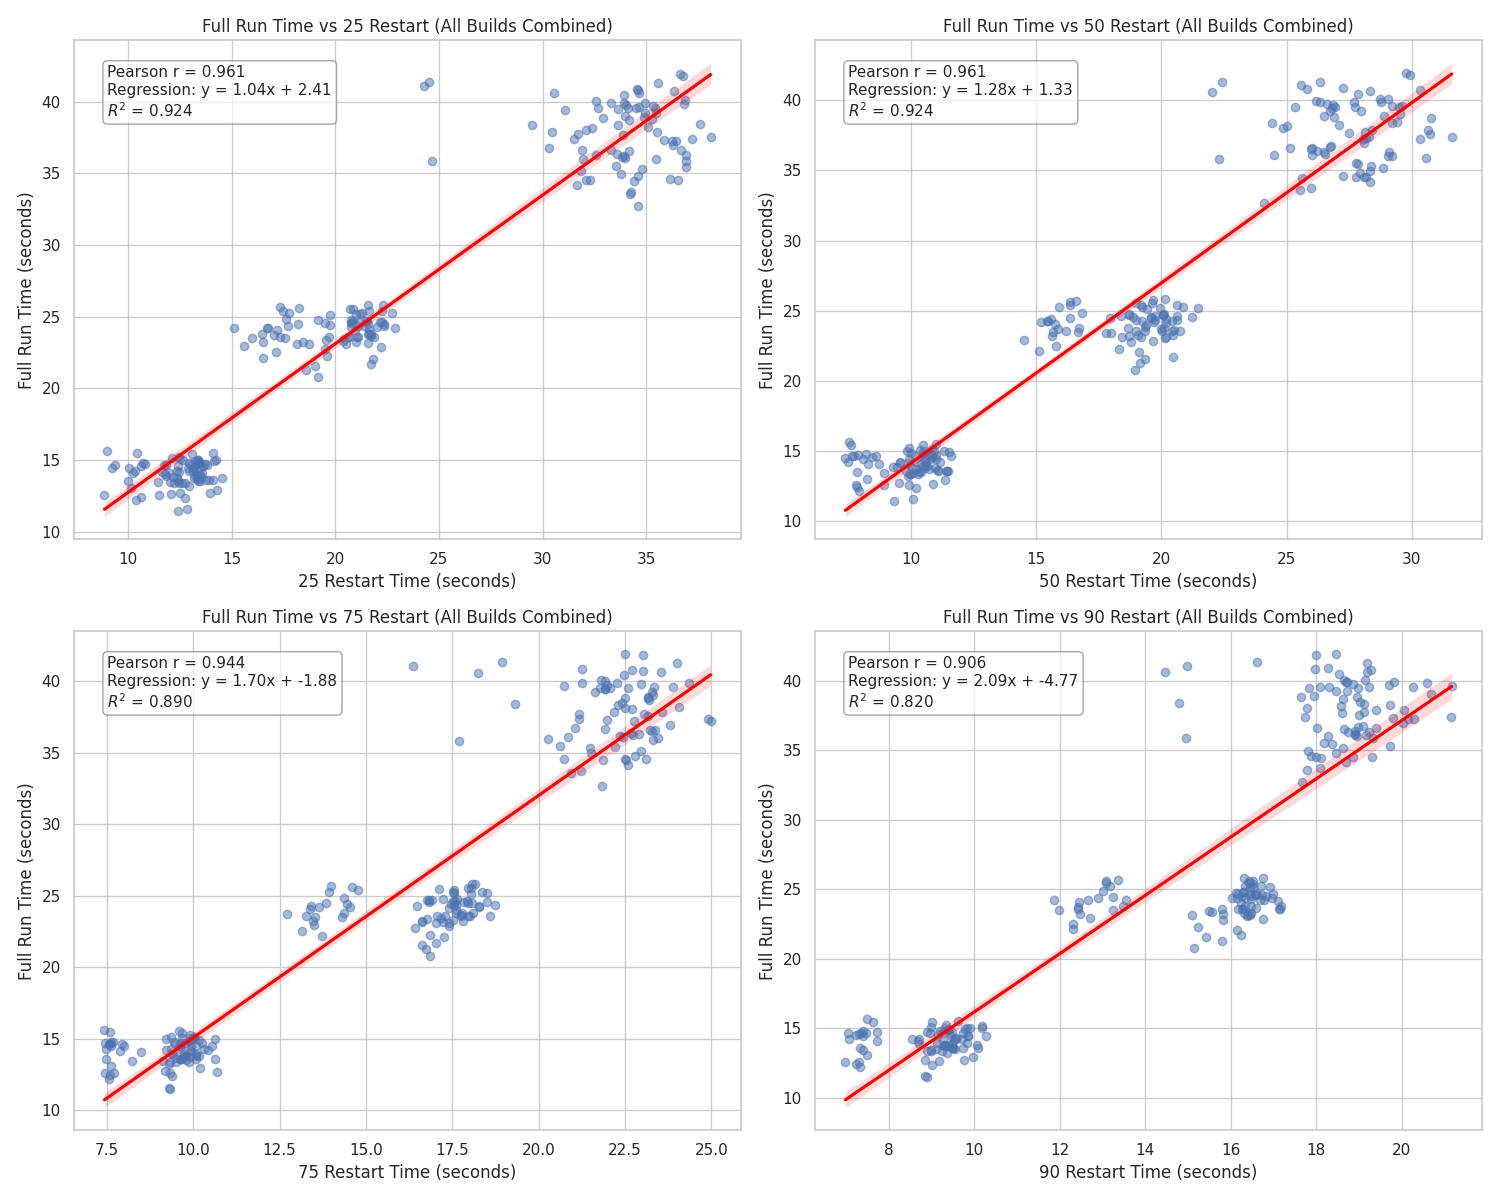
Statistical Data Visualization
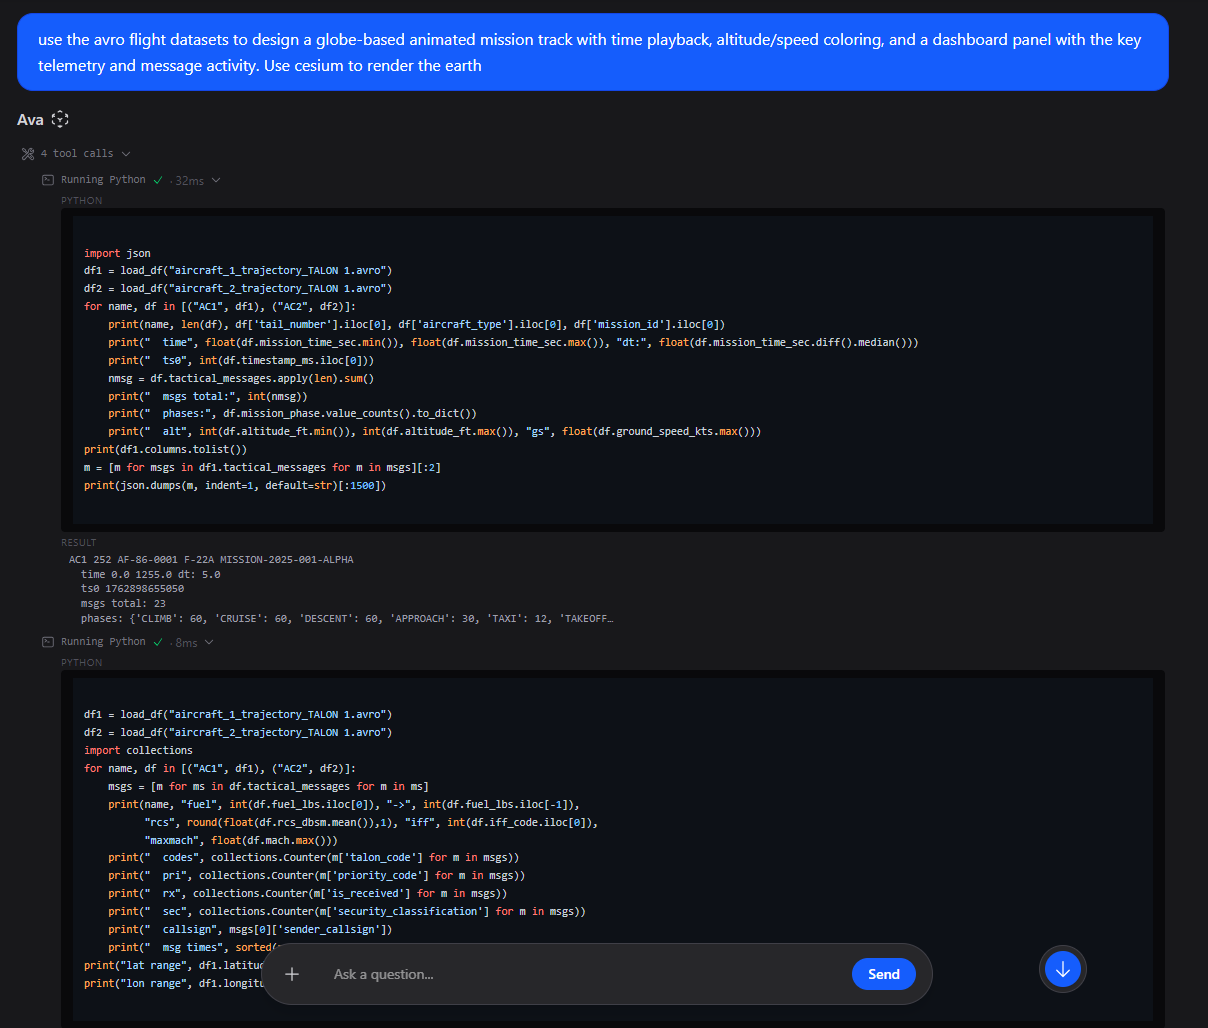
Python Code Transparency